What is Value Stream Mapping?
 Value Stream Mapping (VSM) is designed to help teams achieve a specific business outcome by improving work processes.
In a series of group mapping activities, teams visualize the flow of work from start to finish, identify inefficiencies, delays, and waste. The team uses what they’ve learned to create a roadmap of measurable improvement actions, in service of delivering more value to the customer.
Originally developed at Toyota in the 1940s, VSM has since migrated from factory floors to software delivery, hospitals, and service industries worldwide.
Table of Contents
- Common motivations for Value Stream Mapping in Technology teams
- Who is Value Stream Mapping for?
- Methodology and Main Milestones
- Resources
Common motivations for Value Stream Mapping in Technology teams
- Onboard new customers faster to keep up with growing demand
- Catch quality problems during testing instead of in production
- Simplify processes to reduce back-and-forth communication
- Deliver software more often
- Reduce delays and re-work
- Waste less time
- Align teams on common goals and processes
Here’s what these teams had to say about working with me on these objectives.
Who is Value Stream Mapping for?
- Leaders: Visualize what’s blocking your business goals
- Product People: Speed up feature delivery and time-to-value
- Designers: Get user feedback faster by removing process roadblocks
- Engineers: Apply DevOps principles to improve deployment workflows
- Anyone who wants to make work less annoying and improve delivery of value to the customer
Methodology and Main Milestones
Value Stream Mapping involves different types of maps, preparation and activities.
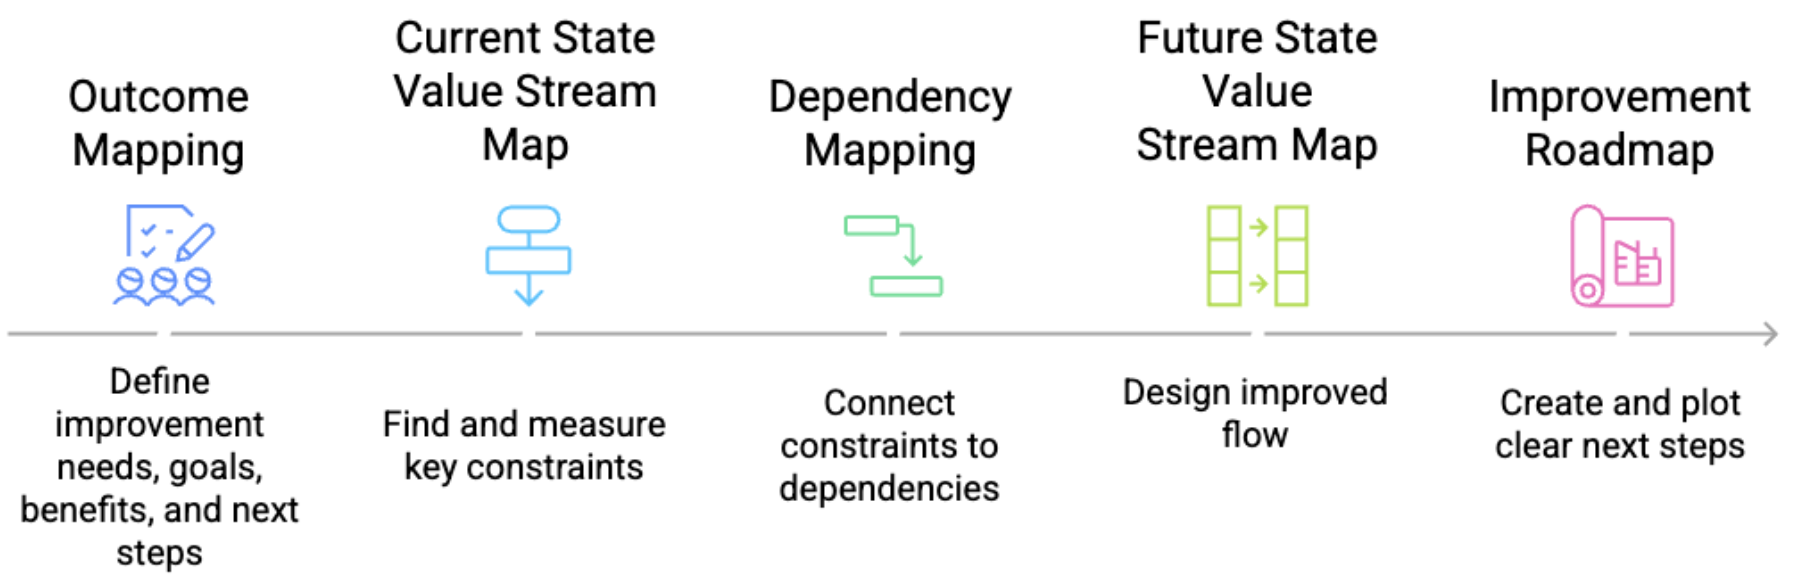
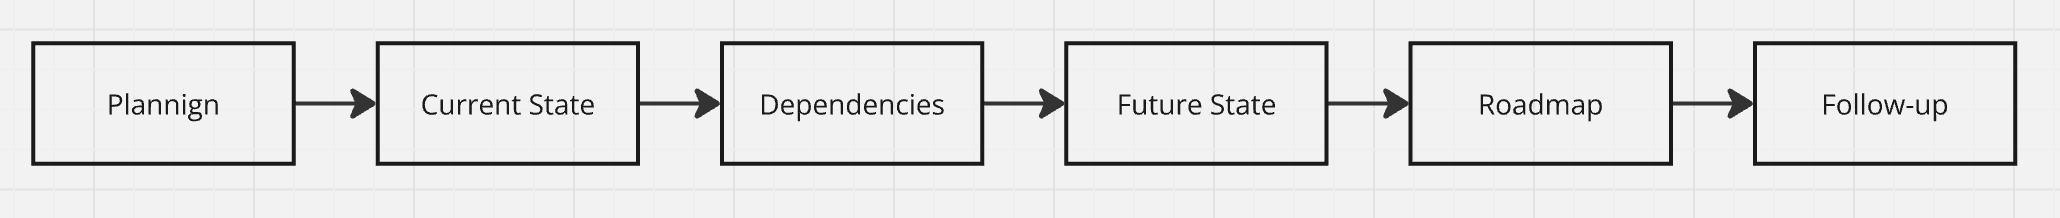
Here’s an overview of the main milestones in a Value Stream Mapping project:
- Current State Problems and Business Needs
- Current State Mapping
- Dependency Mapping
- Future State Mapping
- Improvement Roadmap
- Final Presentation
- Follow-up Period
- Logistics and Time Commitment
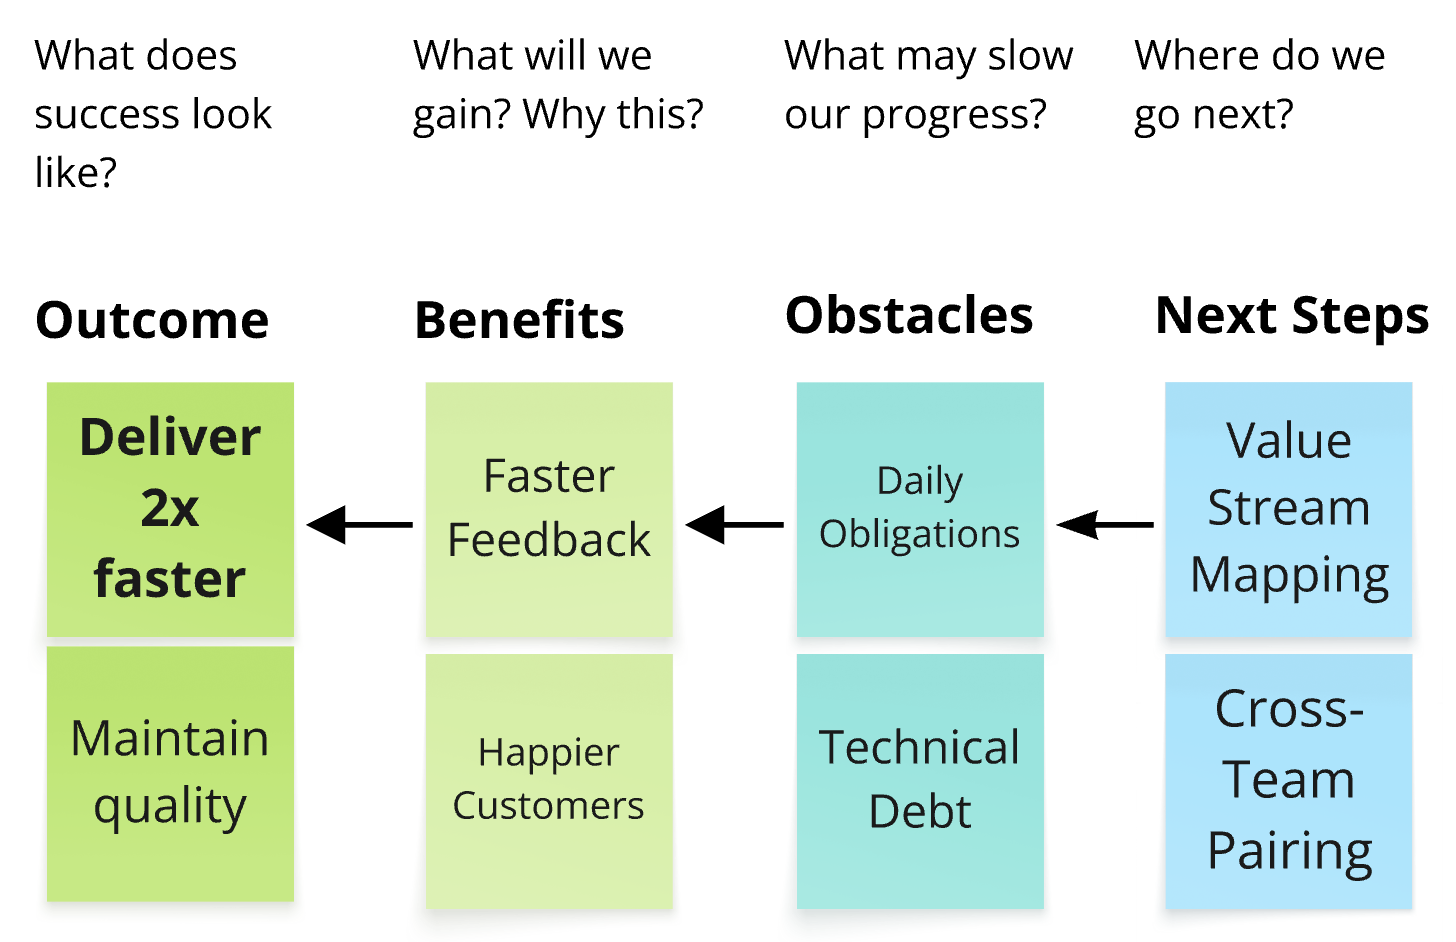
Current State Problems and Business Needs
We work together to define improvement needs, goals, benefits, participants, obstacles, and next steps.
Depending on complexity and time, we might keep it simple with an Outcome Map, or use a Charter for a more in-depth and iterative approach.
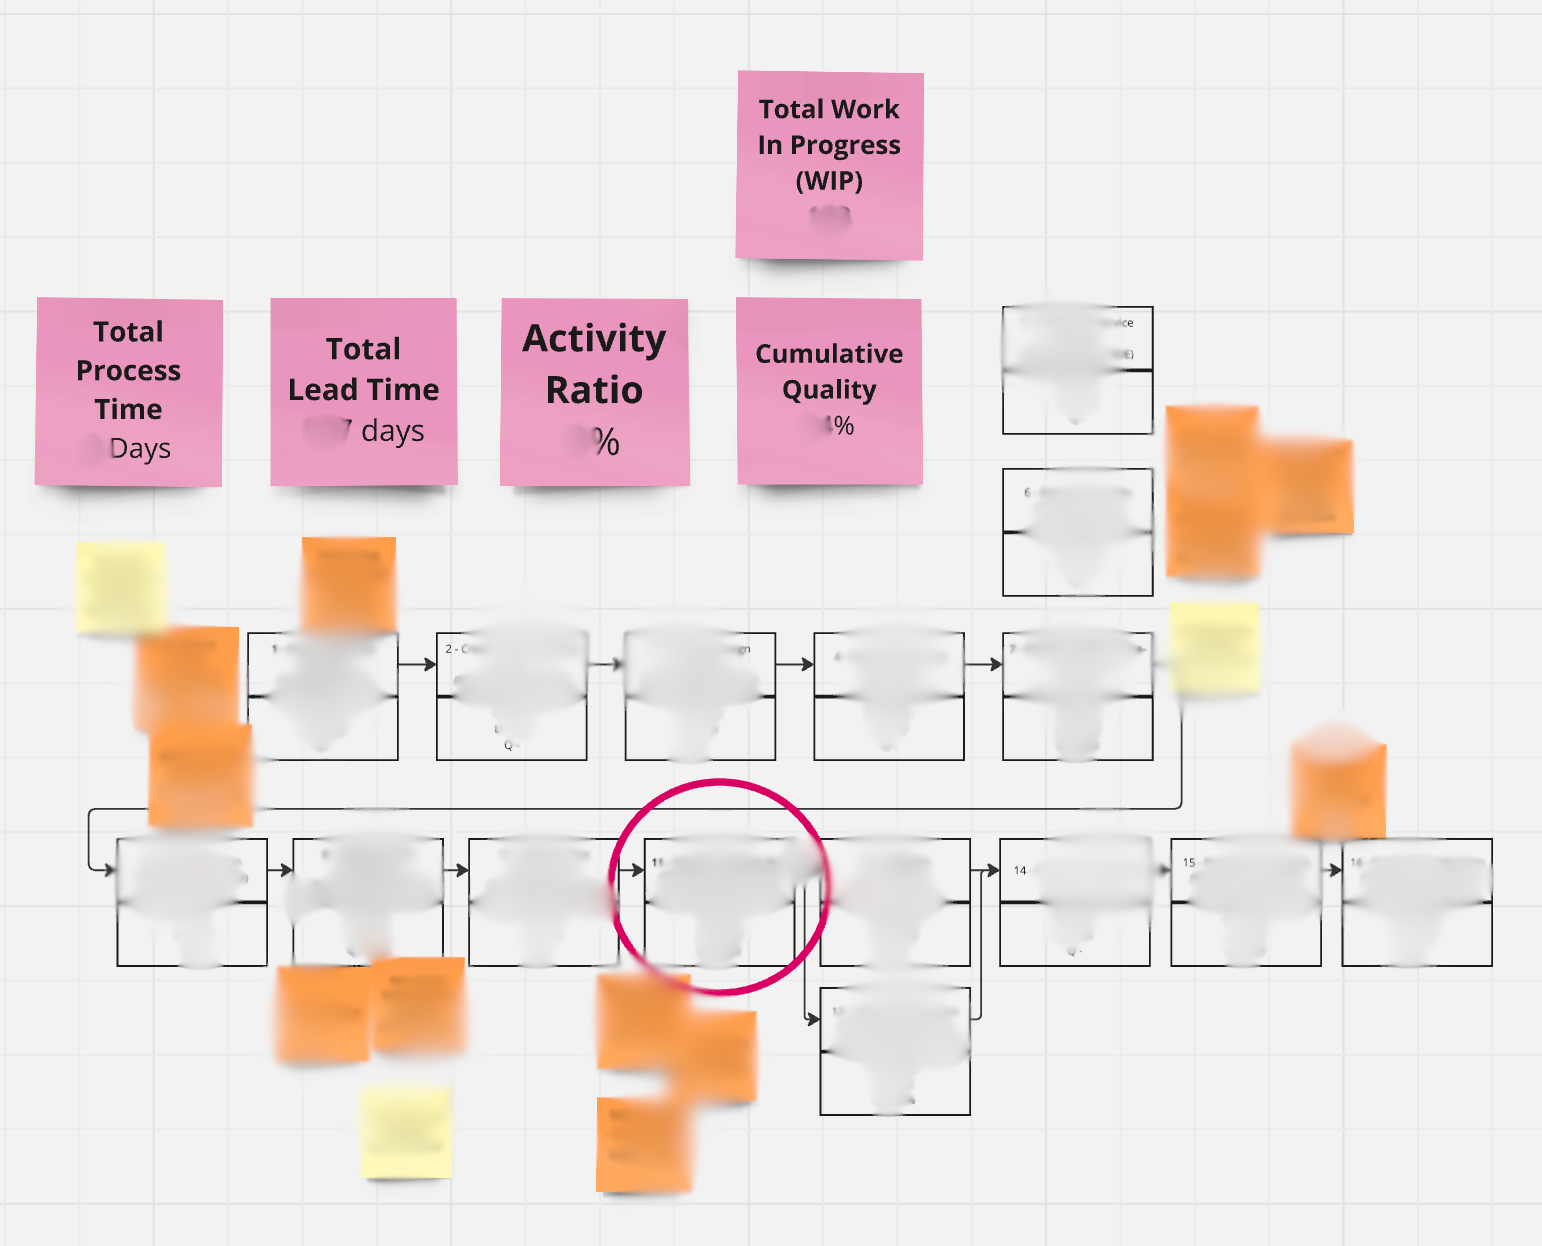
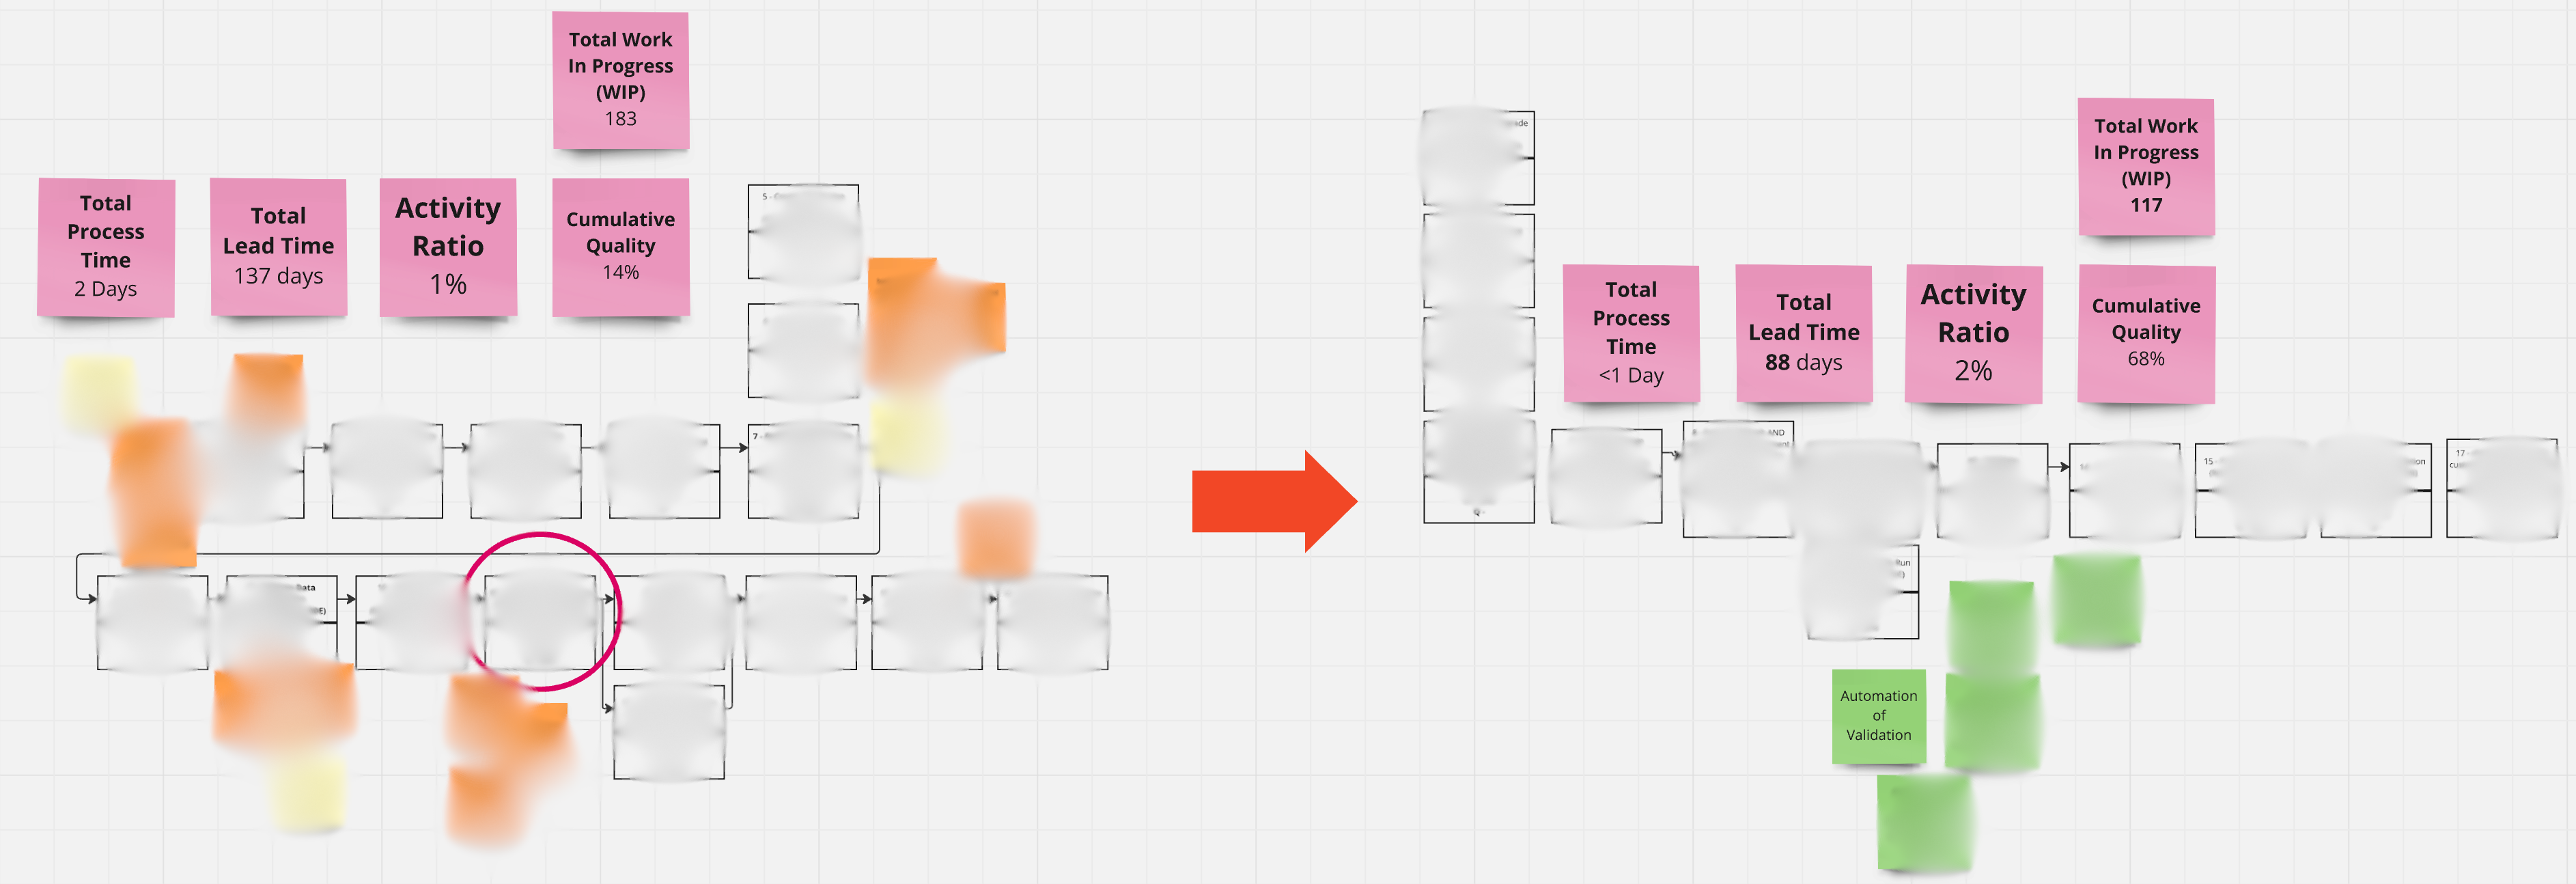
Current State Mapping
Map the main processes required to deliver value to the customer, measure the work and wait time, and find the constraint slowing us down.
Note: Typically, teams are pretty good at improving their own processes and know where the bottlenecks are. It’s where there are dependencies with other teams that it becomes challenging to improve.
Learn more about Current State Mapping
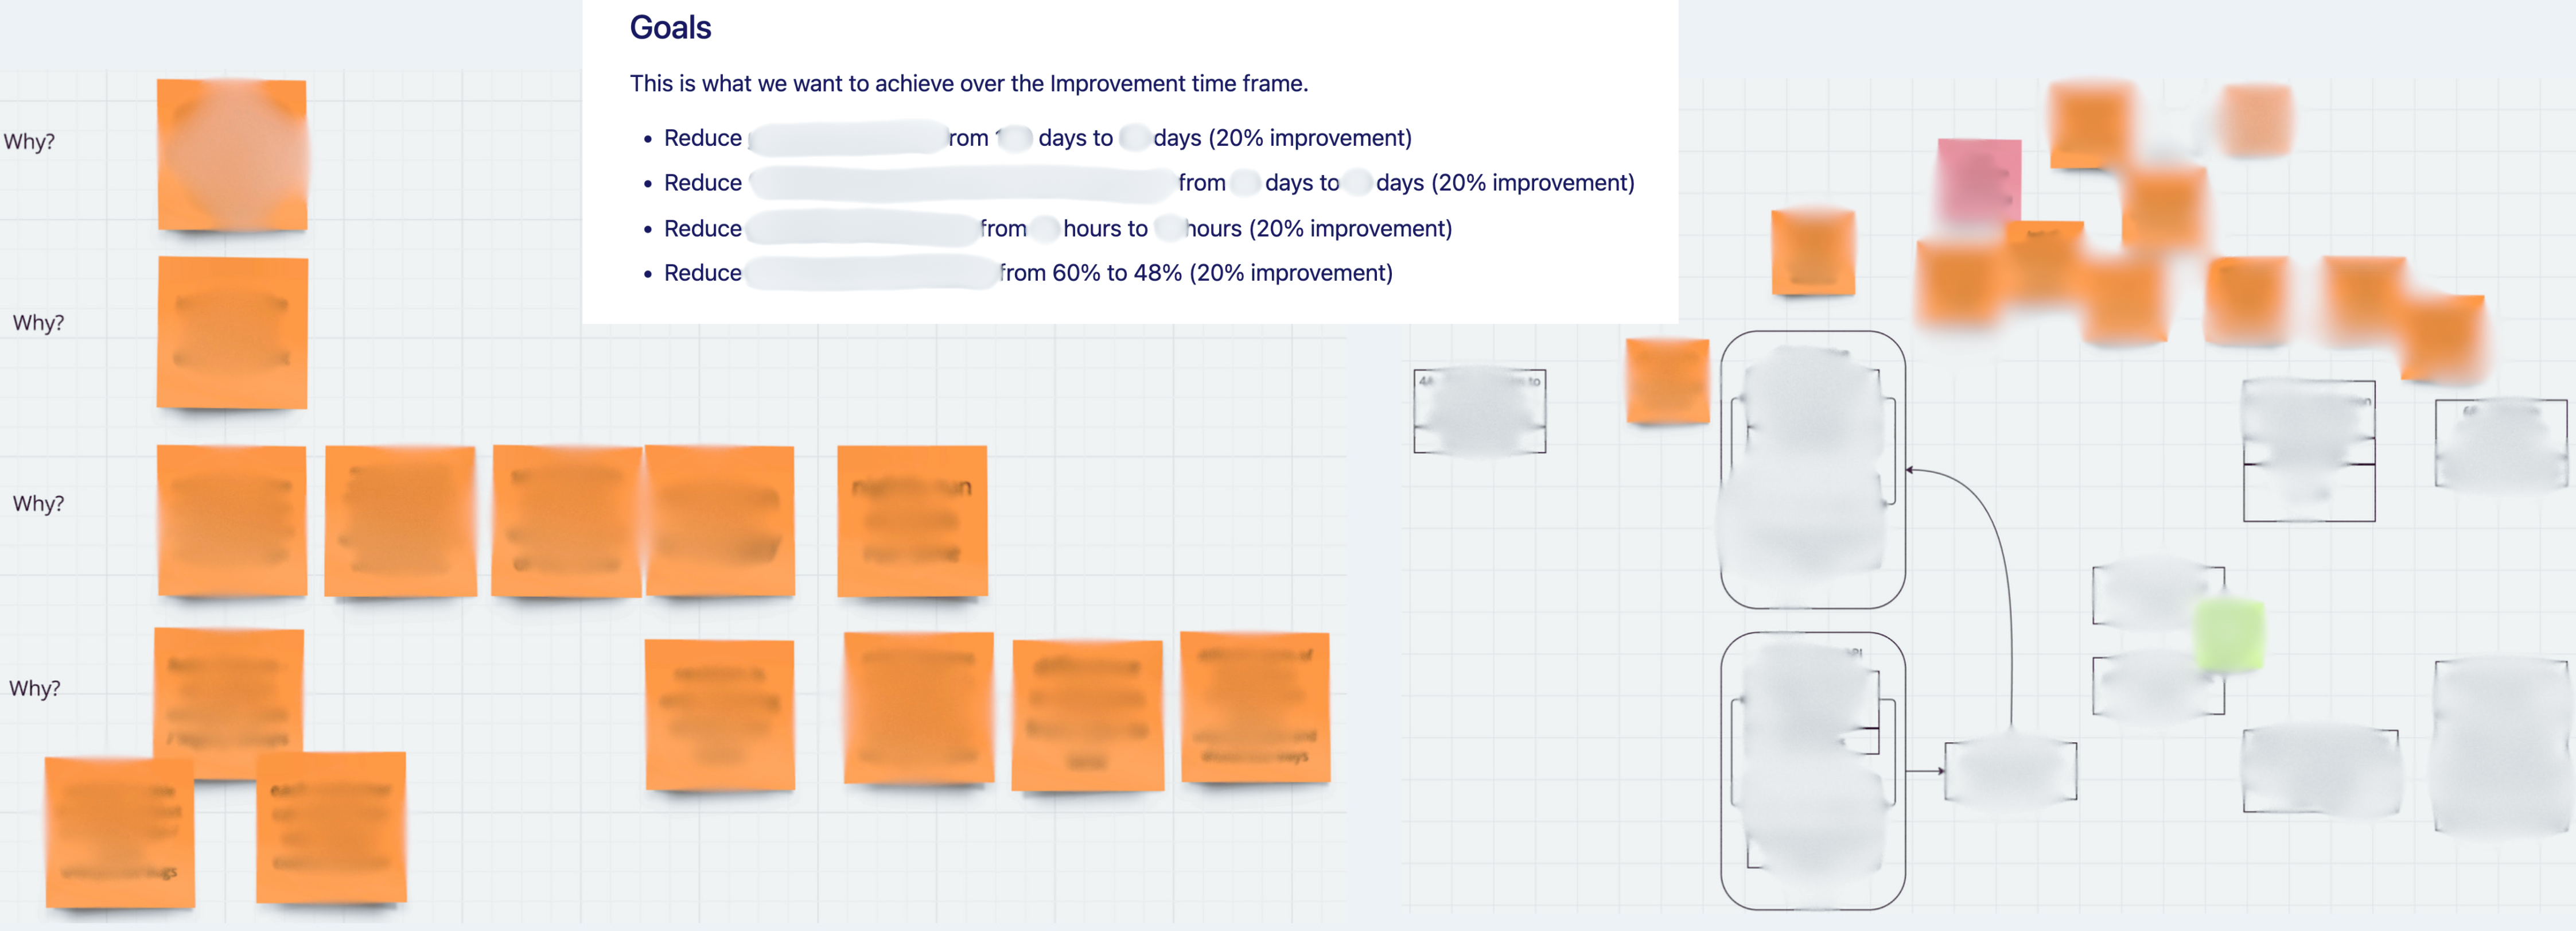
Dependency Mapping
Identify dependencies and contributing factors for the constraint. Build a case for collaboration, why it benefits the customer and the company.
Learn more about Dependency Mapping
Future State Mapping
Identify sources of waste in the value stream and redesign it for reduced waste and improved flow.
Sources of Waste: Defects, Waiting, Handoffs, Non-Utilized Talent, etc.
Learn more about Future State Mapping
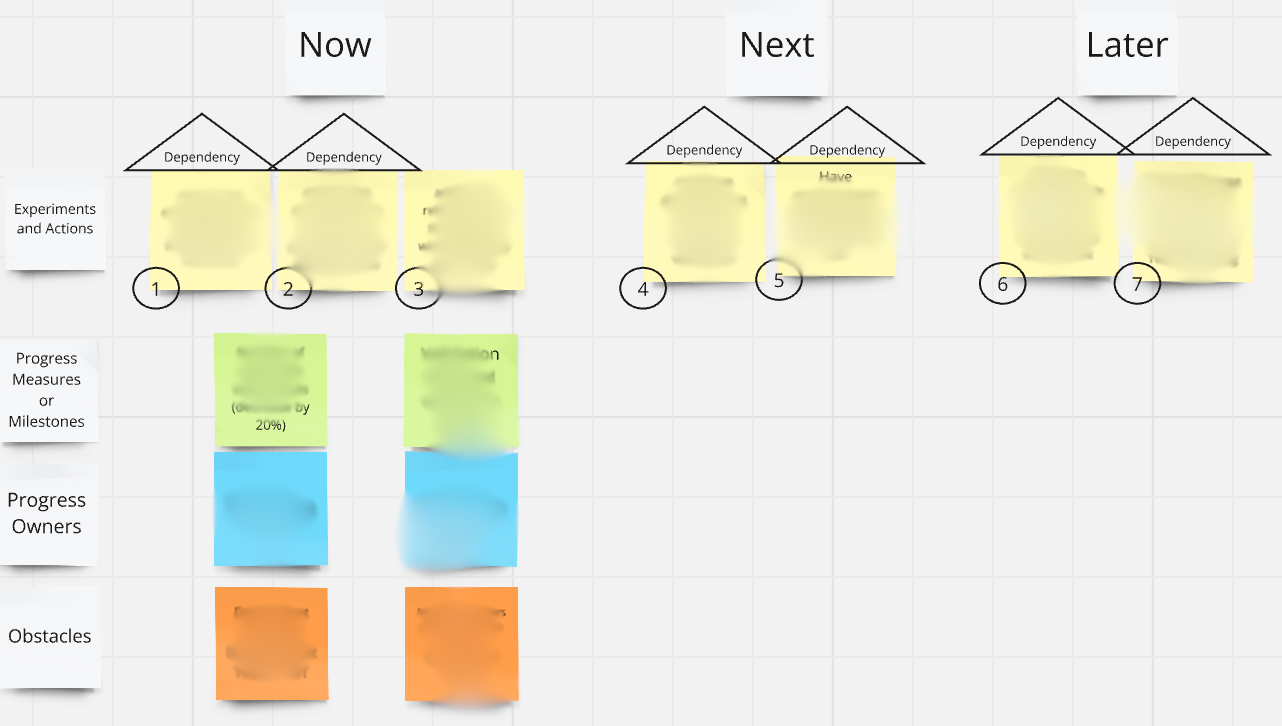
Improvement Roadmap
Sequence improvement actions into a roadmap based on importance and feasibility, with progress measures and owners.
Learn more about the Improvement Roadmap
Final Presentation
The team shares what they have learned with a wider stakeholder audience. This is a great opportunity to get buy-in for the upcoming improvements.
Follow-Up Period
After the workshop we measure progress against the metrics set by the team, discuss blockers and changes to the plan.
Logistics and Time Commitment
You can start by booking a 30 minute call with me and we can draw a quick outcome map and see if you’re interested in doing more.
The full workshop is 5 sessions of 1h30min + a final presentation and follow-up sessions if you wish.
A full workshop will take up roughly 8 hours of your team’s time over 2 weeks. Here’s what that could look like:
| Sessions | Duration | Date | Purpose |
|---|---|---|---|
| Outcome Mapping | 1 session of 1h30min + interviews | Week Before | Define improvement needs, goals, benefits, and next steps |
| Current State Value Stream Mapping | 1h30min | Monday | Find and measure key constraints |
| Dependency Mapping | 1h30min | Tuesday | Connect constraints to dependencies |
| Future State Value Stream Mapping | 1h30min | Wednesday | Design improved flow |
| Improvement Roadmap | 1h30min | Thursday | Create and plot clear next steps |
| Final Presentation | 30min | Friday | Share workshop findings, create buy-in |
| Follow-up | 30min every 2 weeks | Following 3 months | Measure progress, adjust, remove blockages |
Resources
- 2min Value Stream Mapping Workshop Overview
- Intro to Value Stream Mapping Workshop (recording) by Miguel and Erica Engelen
- Flow Engineering by Steve Pereira and Andrew Davis (2024)
- Value Stream Mapping by Karen Martin and Mike Osterling (2013)
- Team Topologies by Matthew Skelton and Manuel Pais (2019)
- The DevOps Handbook by Gene Kim, Jez Humble, Patrick Debois, and John Willis (2016)